“While many espouse the long-held expression that, “the trend is your friend,” we believe it’s important to add the corollary, “unless the trend is about to end.”
— Tom DeMark

What does Tradeinsider.com (DeMark®) fix or help you with?
Have you ever bought a top or sold a bottom? Are you closing your winning trades to early?
DeMark® is not a money-making system, but it does highlight exhaustion points of buyers and sellers—helping you make better decisions about when to enter or exit a trade.
There's a high chance you've bought or sold right when a DeMark® 9 or 13 signal appeared—without even knowing it. Or maybe you closed your trade on bar 5 instead of waiting for bar 9 or 13. Our mission is to keep you connected to the market by sending alerts when signals appear on daily and weekly charts. These signals can help you avoid FOMO buying or panic selling.
If you're an active day trader, our charts can provide a powerful additional layer to your trading toolkit. DeMar®k indicators can help confirm other signals—such as SAR, Fibonacci levels, or trendlines. For example, when you see a 13 in confluence with another indicator, it can boost your confidence in your decision. DeMark can also help you avoid exiting a trade too early by showing you when exhaustion is actually present with a 9 or 13 signal.
——————
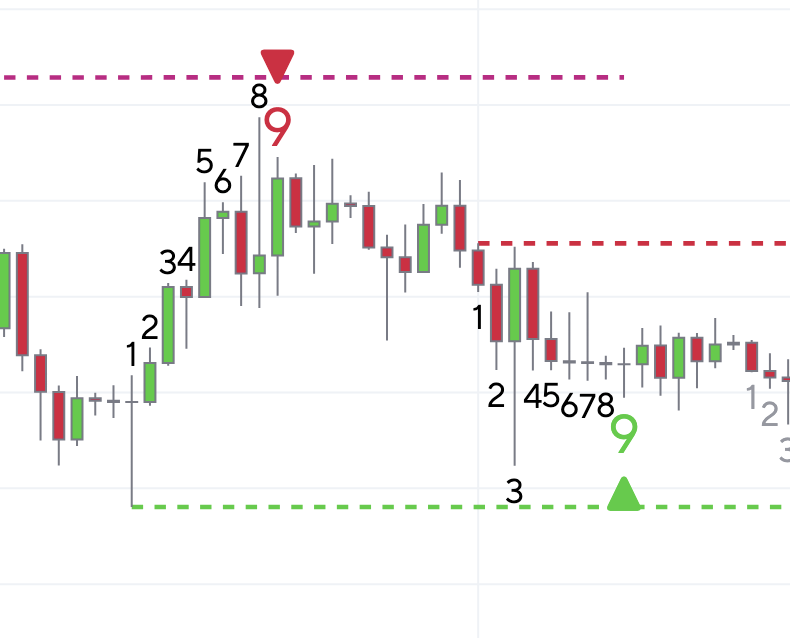
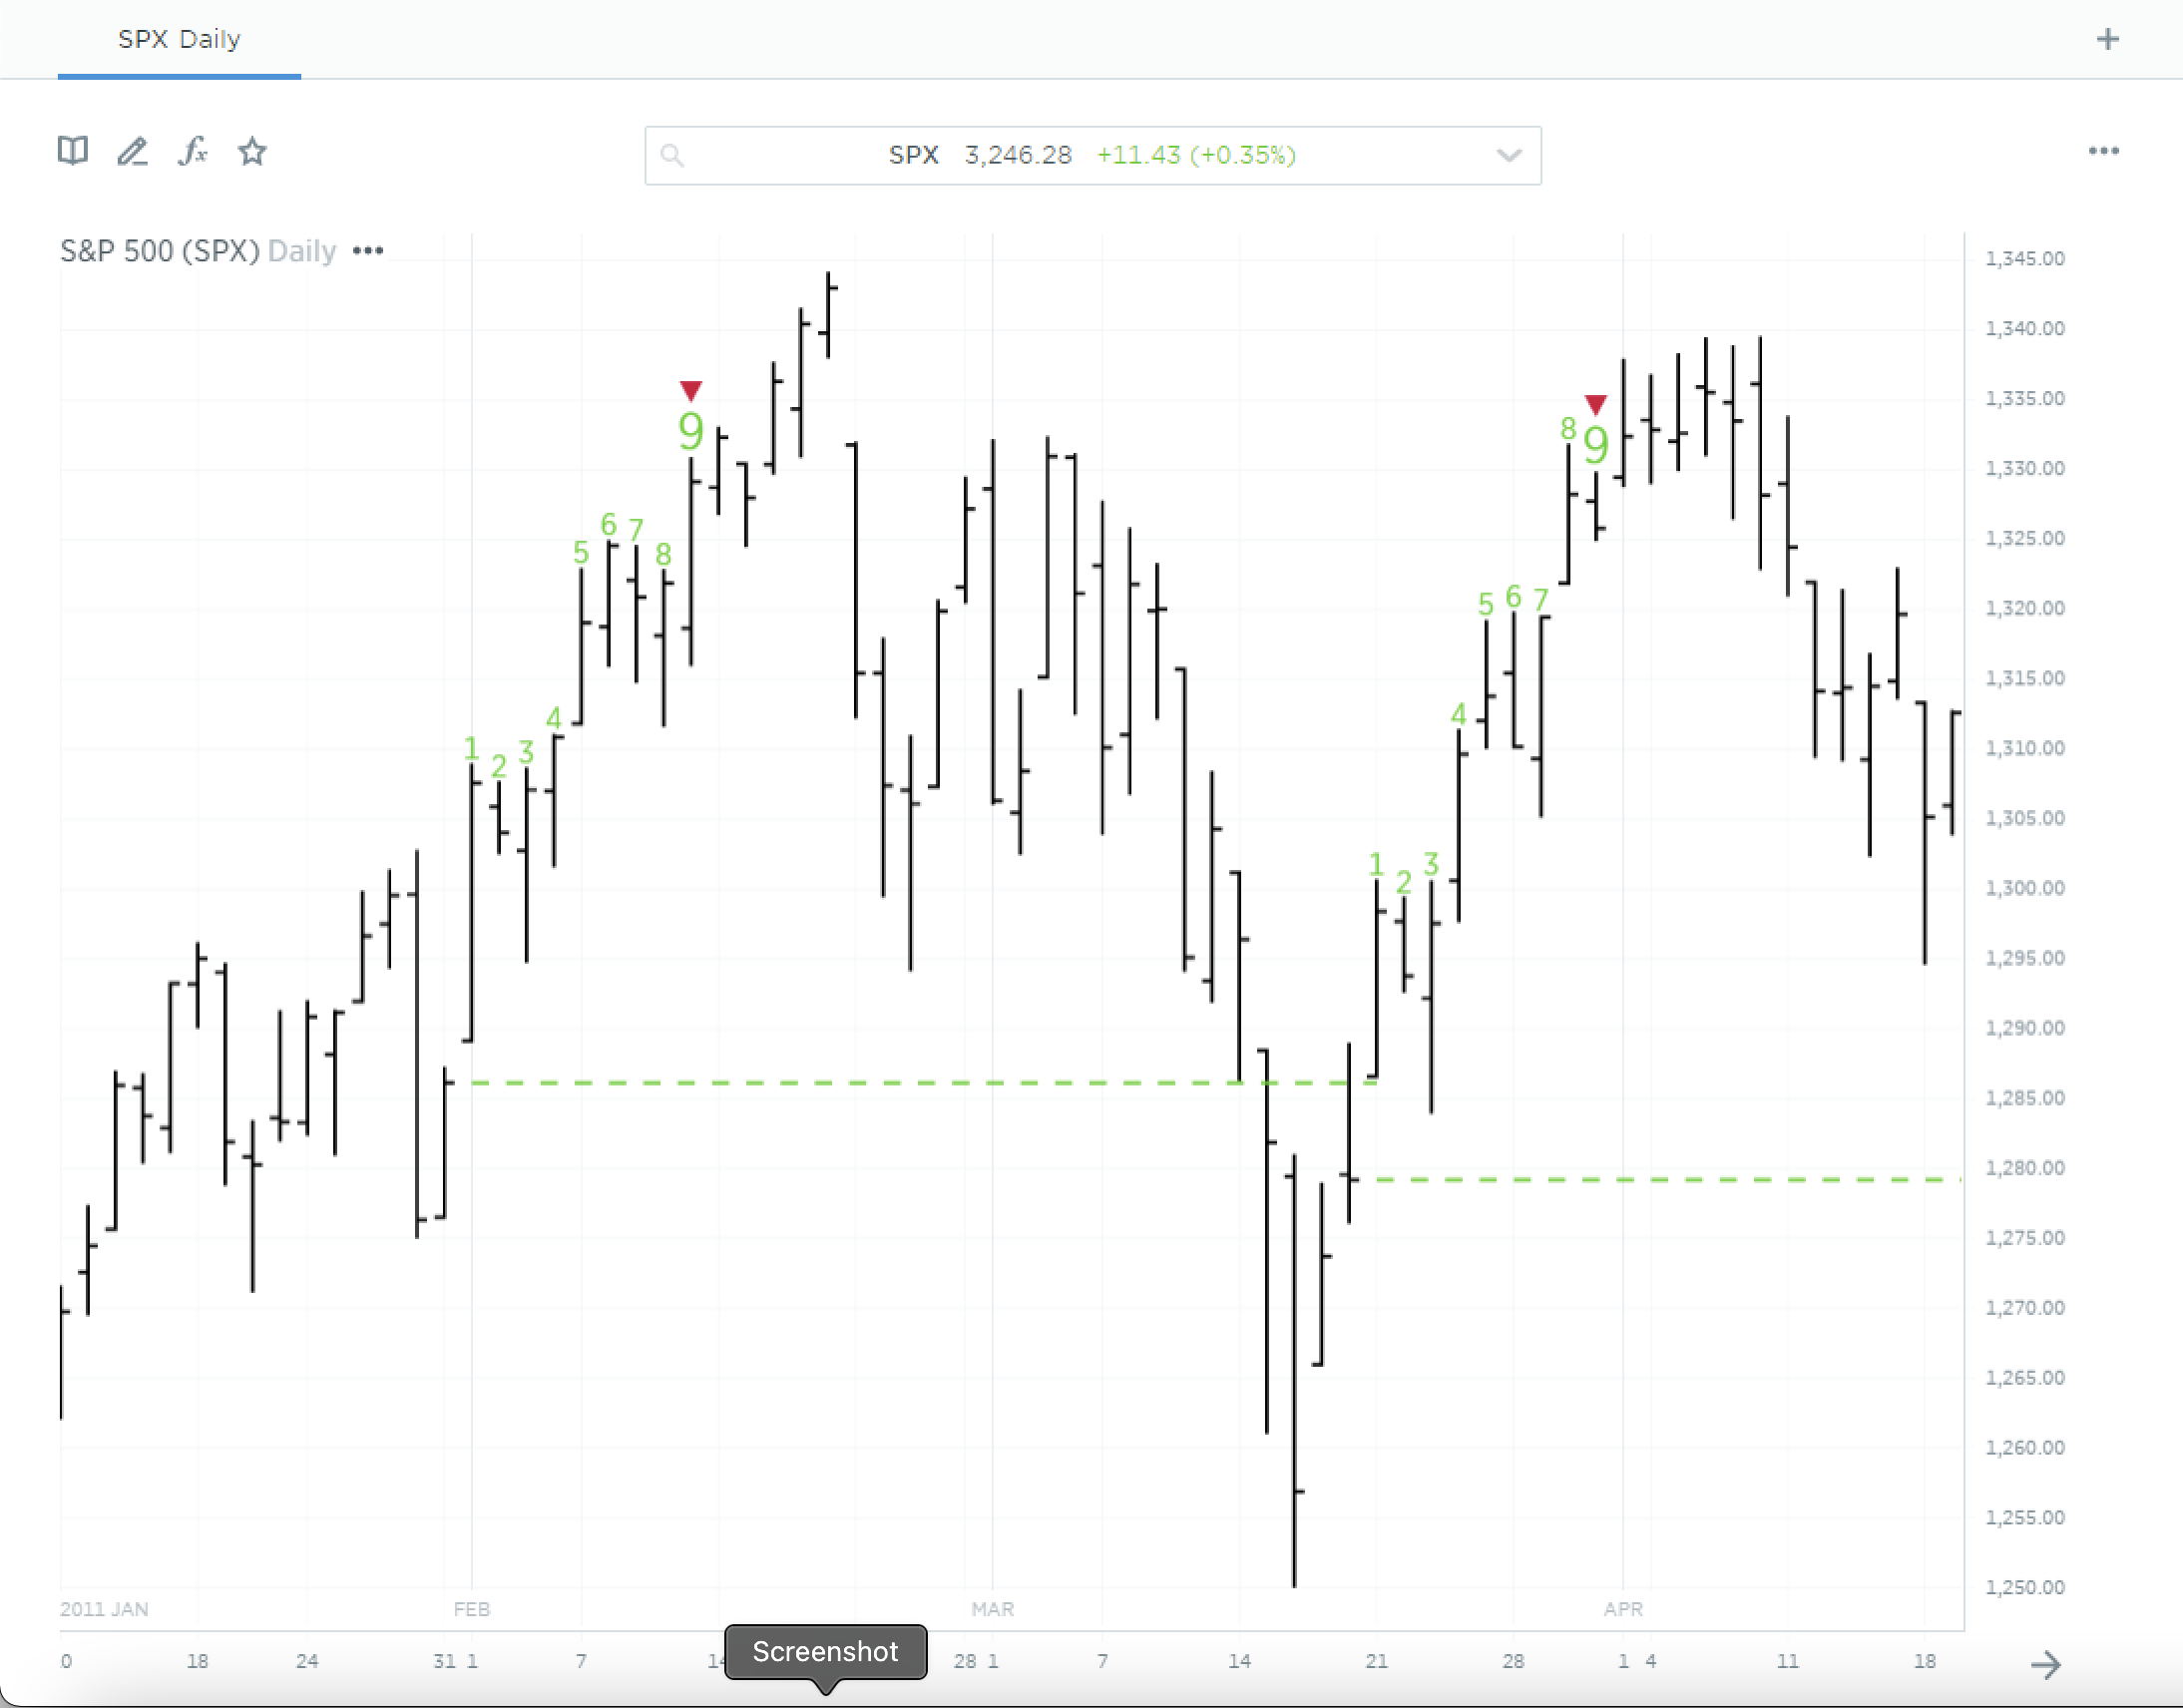
What is the setup 9 phase?
A Buy Setup occurs when there are 9 consecutive closes, each one lower than the close four bars earlier.
A Sell Setup occurs when there are 9 consecutive closes, each one higher than the close four bars earlier.
——————
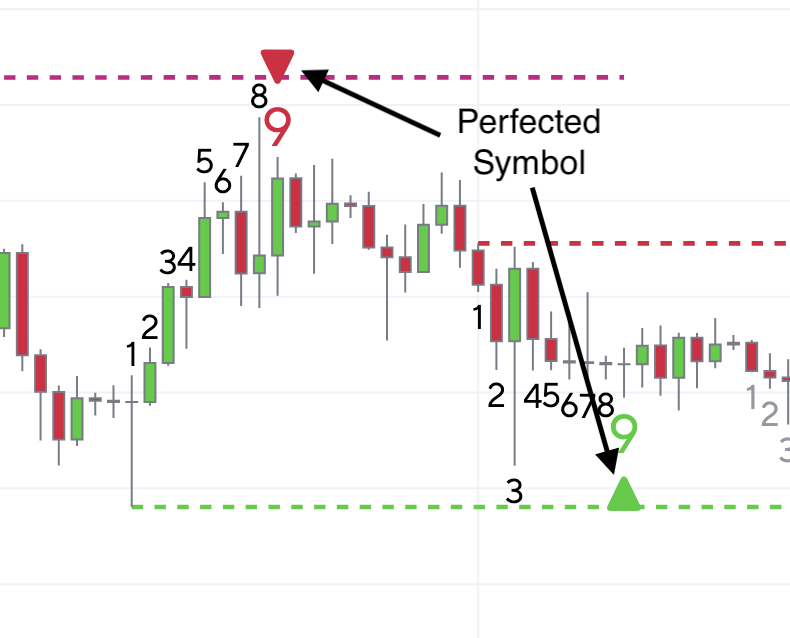
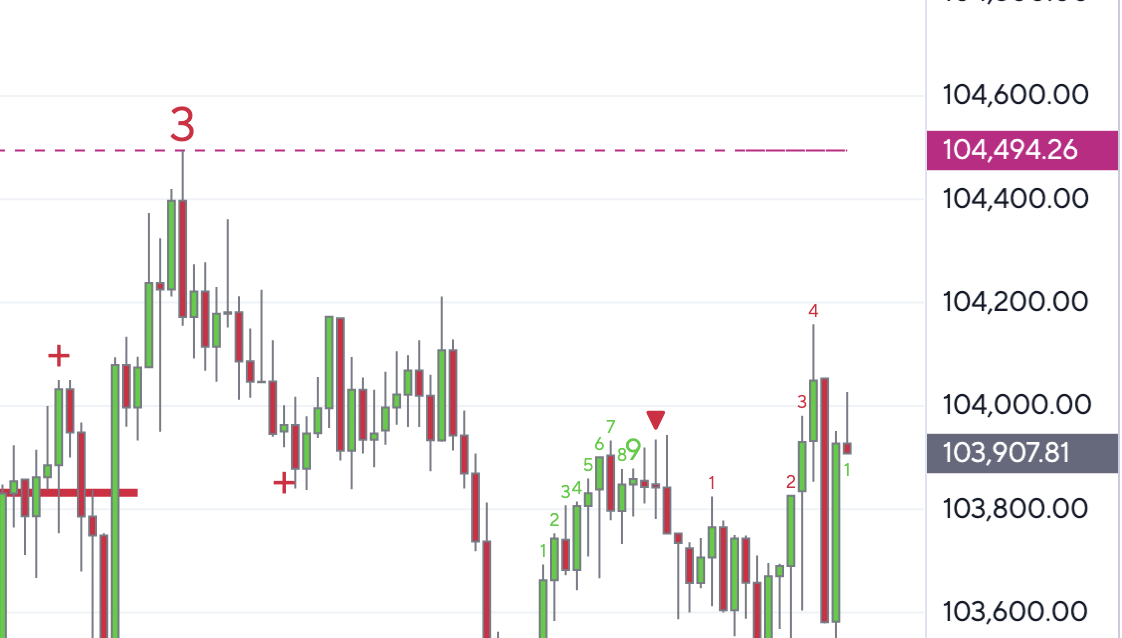
What is a perfected 9? (What is the small red or green arrow above the 9?)
Setups can be classified as either “Perfected” or “Imperfected.”
A Setup is considered Perfected when the 9th bar is completed and either bar 6 or bar 7 (or both) is exceeded. This indicates a stronger confirmation of potential price exhaustion.
The point of perfection is typically marked with a small red or green arrow on the chart, signaling the setup's readiness for a possible reversal.
——————
What is the TDST? (What is the red or green dotted line usually drawn from a 1?)
The TD Setup Trend (TDST) indicator—displayed as a green or red dotted line—is derived from the initial count of the Setup indicator. It helps confirm market trends and identify potential trend failures.
TDST establishes reference levels based on the lowest true low and highest true high from recent price action. These levels serve as key areas of support and resistance, offering valuable insight into the strength and sustainability of a market's price movement.
——————
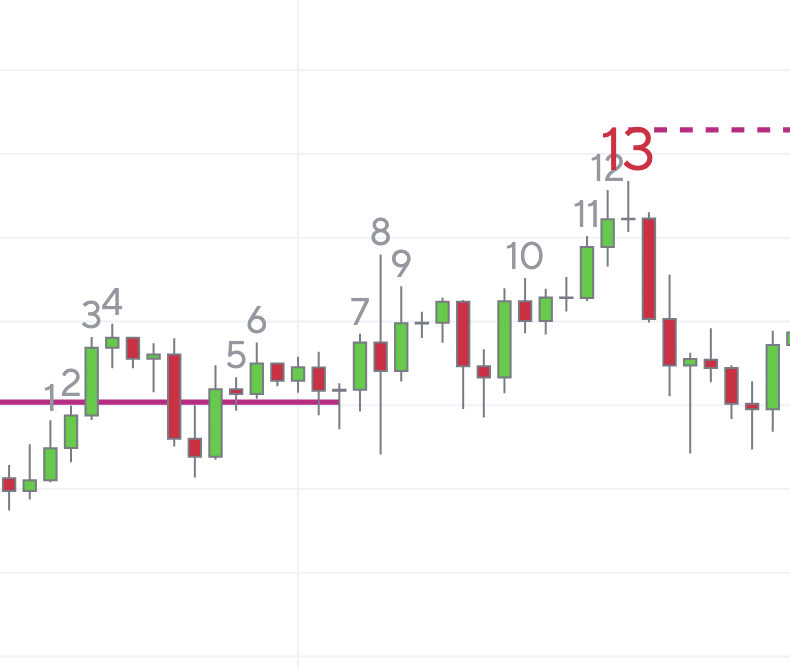
What is the 1 to 13 countdown phase? (What is the red or green count till 12 above the opposite color count till 9?)
The Countdown phase begins after the Setup is complete and is marked by red, non-consecutive numbers on the chart. Its purpose is to measure the exhaustion of buying or selling pressure, depending on the direction of the initial trend identified by the Setup. Countdown helps anticipate when a trend is becoming vulnerable to reversal.
The Countdown is calculated by comparing the close of the current bar to the high (in a sell countdown) or low (in a buy countdown) of two bars earlier. Each time this condition is met, a number is added to the count, indicating the trend’s progression toward exhaustion.
Once the Countdown reaches 13, it signals that the market is likely approaching a reversal point. The Risk Level defines the price zone where the reversal is expected to occur, while the 12-bar rule defines the time frame in which this reversal should happen.
Unlike the Setup, the Countdown does not require consecutive bars, allowing it to function effectively in both trending and range-bound markets.
——————
What is the risk level (purple dotted line)?
The Risk Level identifies the potential residual momentum remaining in a trend after a Countdown has completed. It is often viewed as a secondary signal of price exhaustion, marking the zone where a reversal is expected, while also serving as a key support or resistance level on the chart.
When a Countdown series completes, a Risk Level is generated to define:
The zone within which a reversal should occur, and
The maximum price threshold the market can reach while still maintaining the validity of the buy or sell signal.
For a Buy Countdown, the Risk Level is the price above which the buy signal (13) remains valid. This level acts as support during market weakness.
For a Sell Countdown, the Risk Level is the price below which the sell signal (13) remains valid. This level acts as resistance during strength.
Think of the Risk Level as the maximum buffer a signal can tolerate before it is considered invalid due to excessive momentum in the opposite direction.
As with many other DeMark® Indicators, qualified and disqualified breakout rules apply, helping to determine whether the Sequential signal remains intact or has been invalidated by market action.
——————
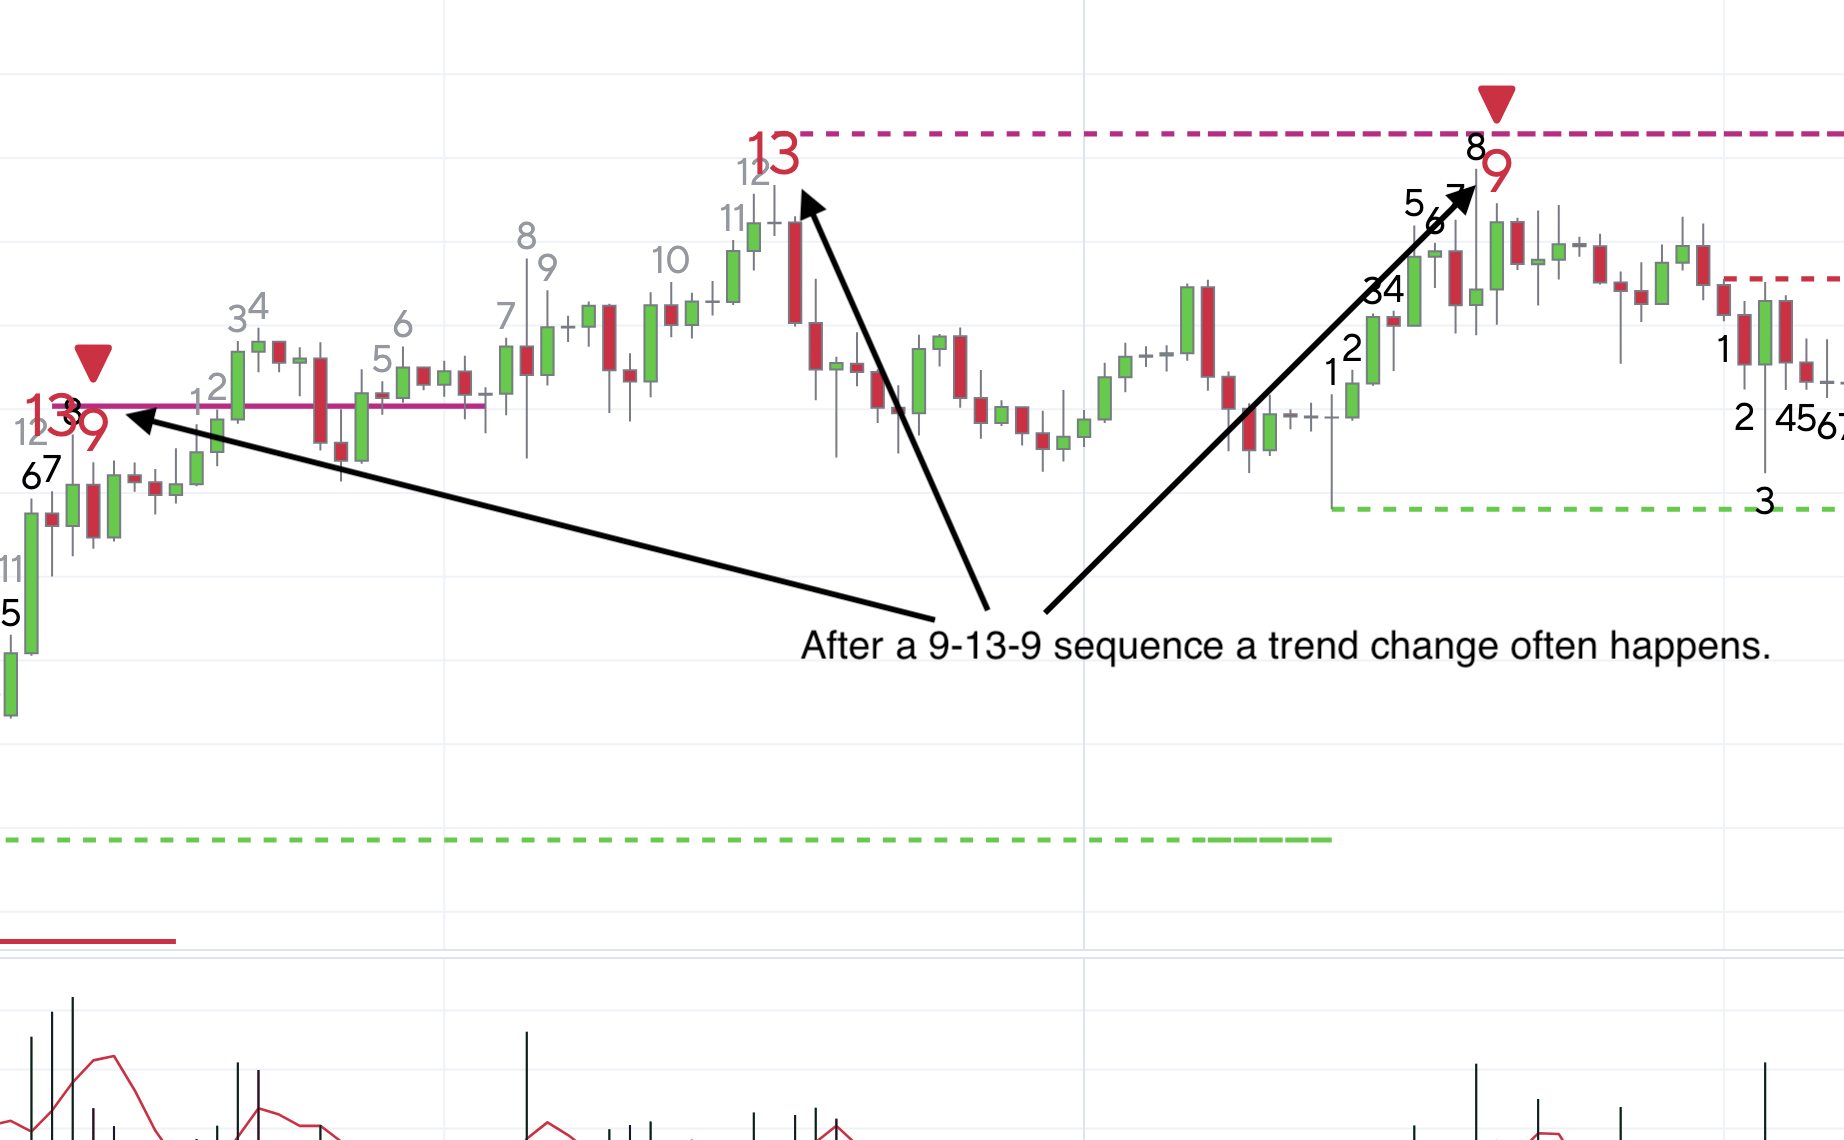
How likely is a turn around if a 13 countdown is recorded?
Also known as the 12-bar rule, this principle states that a reversal should occur within 12 price bars following the completion of a Countdown 13. If no meaningful reversal takes place within this window, the 13 signal is considered less likely to be effective, and the current trend is expected to continue.
Of course, this doesn’t mean the market won’t eventually turn—but it suggests that the immediate opportunity has passed. In such cases, it's often best to wait for the next qualified setup before acting.
——————
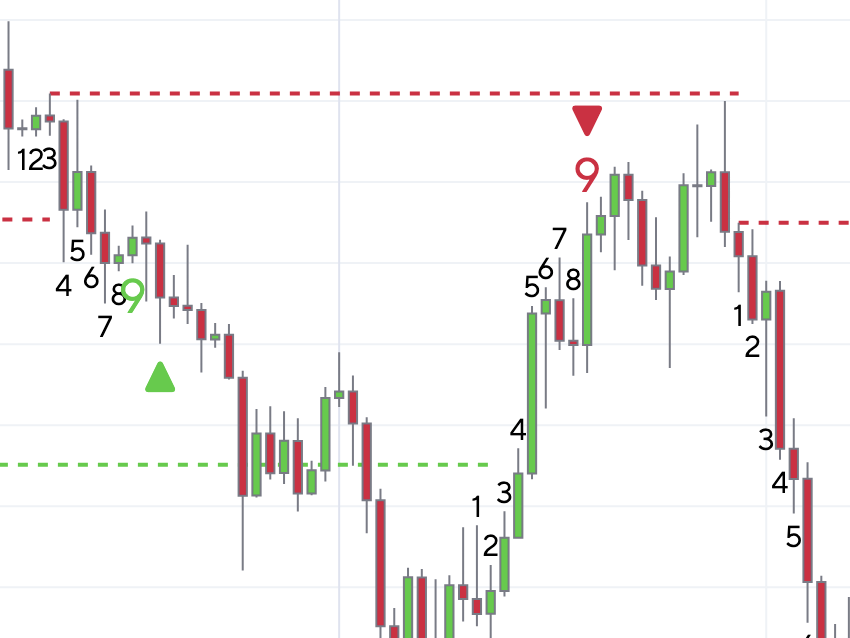
When is a countdown canceled and why do I see a 9 setup but no 13 countdown?
Once completed, a Countdown is permanent and never altered. However, Countdowns can be canceled during their construction phase. There are two scenarios where a Countdown series would be removed from the chart.
The first Countdown cancellation scenario occurs when a subsequent Setup is confirmed in the opposite direction prior to the completion of the Countdown phase. The reasoning is that current market conditions have changed from the point at which the initial Setup was confirmed, to where the new Setup more accurately reflects the current status. Therefore the Countdown that was constructed off the Setup that is no longer relevant is canceled and removed from the chart.
The second Countdown cancellation scenario takes place when the TD Setup Trend (TDST) is violated, suggesting a conclusion to the previous trend and a confirmation of a new one. In these cases, a True High that occurs below the TDST Downside, or a True Low that occurs above the TDST Upside, cancel the construction of the incomplete Countdown phase and removes the counts from the chart.
——————