How to apply our charts
How to benefit from signals for a market and/or an asset of your portfolio.
DeMark® Indicators make it possible to anticipate price activity for every asset class, region, every time interval and every data set and help with generating ideas, determining positions, constructing portfolios and managing risk.
Bigger Picture
Once a daily chart shows a signal check the weekly charts (contact us if needed)
TDST & Risklevel
Check the TDST (green/red dotted line) and Risk Levels (purple dotted line) - It should be close to either for a higher risk-reward ratio
Other Indicators
Check close support/resistance, fibonacci levels and trend lines or any other indicator you work with - DeMark® can be the confirmation you have been looking for
Routine
Always check DeMark® before making a move. If a buy-setup is about to occur it might not make sense to sell. And if a price is increasing fast it might not make sense to buy if a sell-setup is about to occur
Trading Samples
Below you see some samples of our DeMark analysis we highlighted to paid subscribers to act on it or just learn. The Tradeinsider.com team will send you these trading alerts highlighted beside the daily scans of all assets we track.
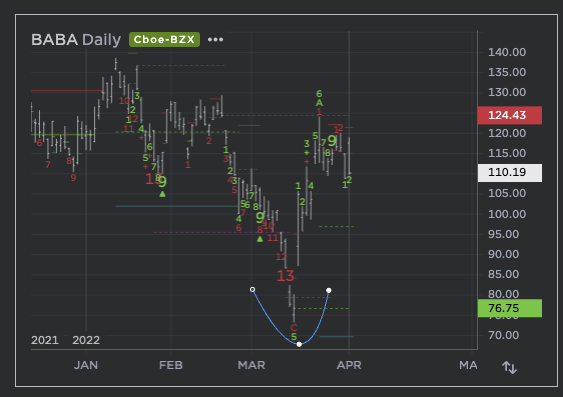
Alibaba
The 13 Buy Countdown on the daily chart was a perfect risk profit moment to purchase into the fear of falling share prices. The Wave-C + Wave 5 was an additional indicator signaling a possible turn.
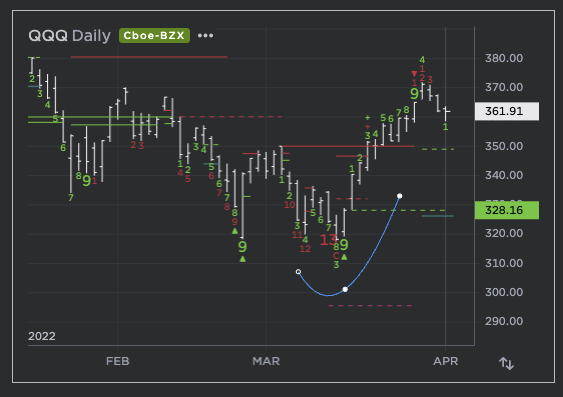
Nasdaq
A beautiful 9-13-9 sequential indicated perfectly a sell exhaustion with gains upwards to 15%. As well as signaling the take profit after 9 days upward movement .
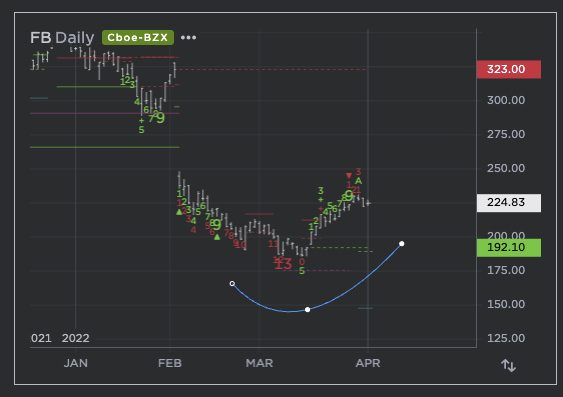
Meta Facebook
After the big drop a lot of people did not know when to act. DeMark indicated perfectly a buy signal after the 9-13 Sequential finished. Allowing 15% gains with a reasonable profit taking after a perfected 9 sell setup.